
Navigation Deep Dive in Synoptix 11
Learn How to Move Effortlessly Through the New Interface
Introduction
Synoptix 11 introduces a completely redesigned navigation system, built to make finding what you need faster, simpler, and more consistent across reports, dashboards, and budgets.
It’s important to note that your menu system may look different from what you see in examples. This is because each User Role is designed to display only the tools and features relevant to your work.
1. The Left-Hand Menu
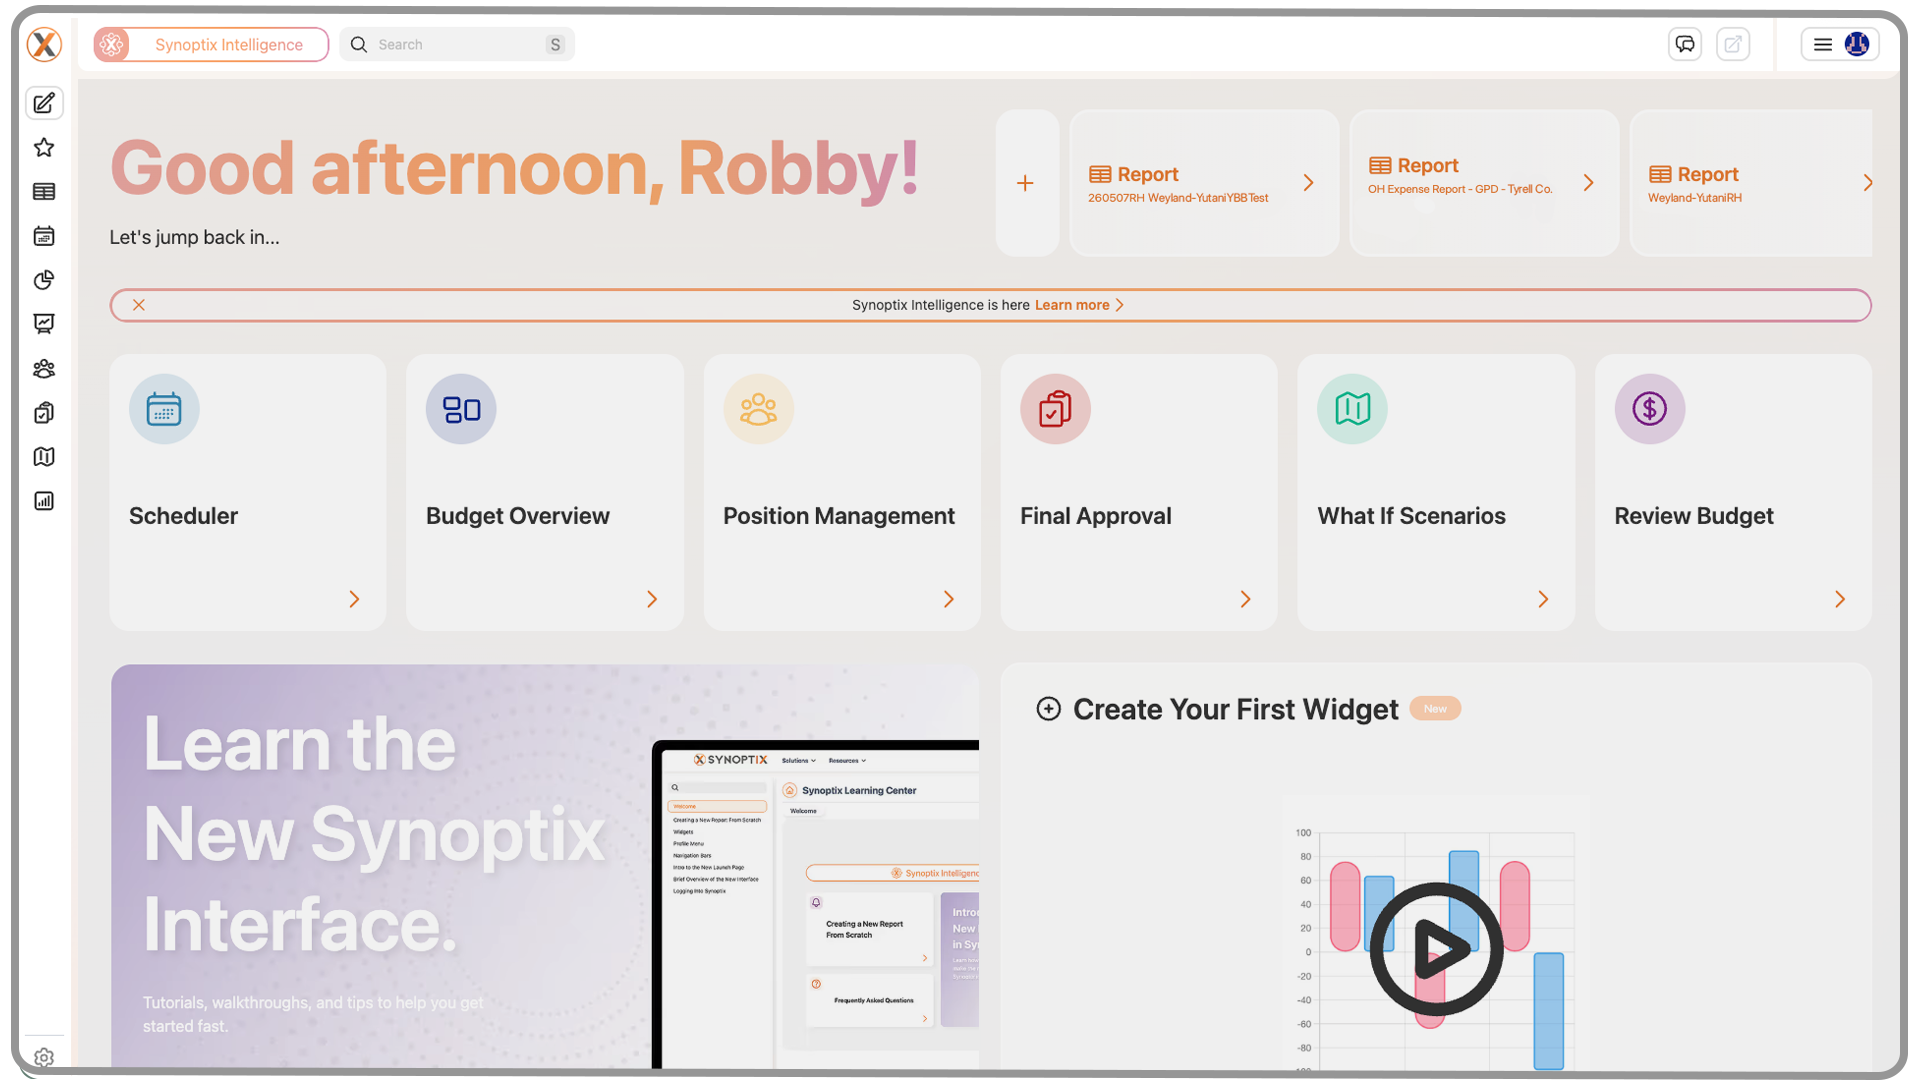
Outside of your Launch Page, the left-hand menu serves as your main navigation hub throughout Synoptix 11.
1.1 Home Button
At the very top of the menu, you’ll see the Synoptix logo.
Clicking this logo at any time will bring you back to your Launch Page—your central workspace.
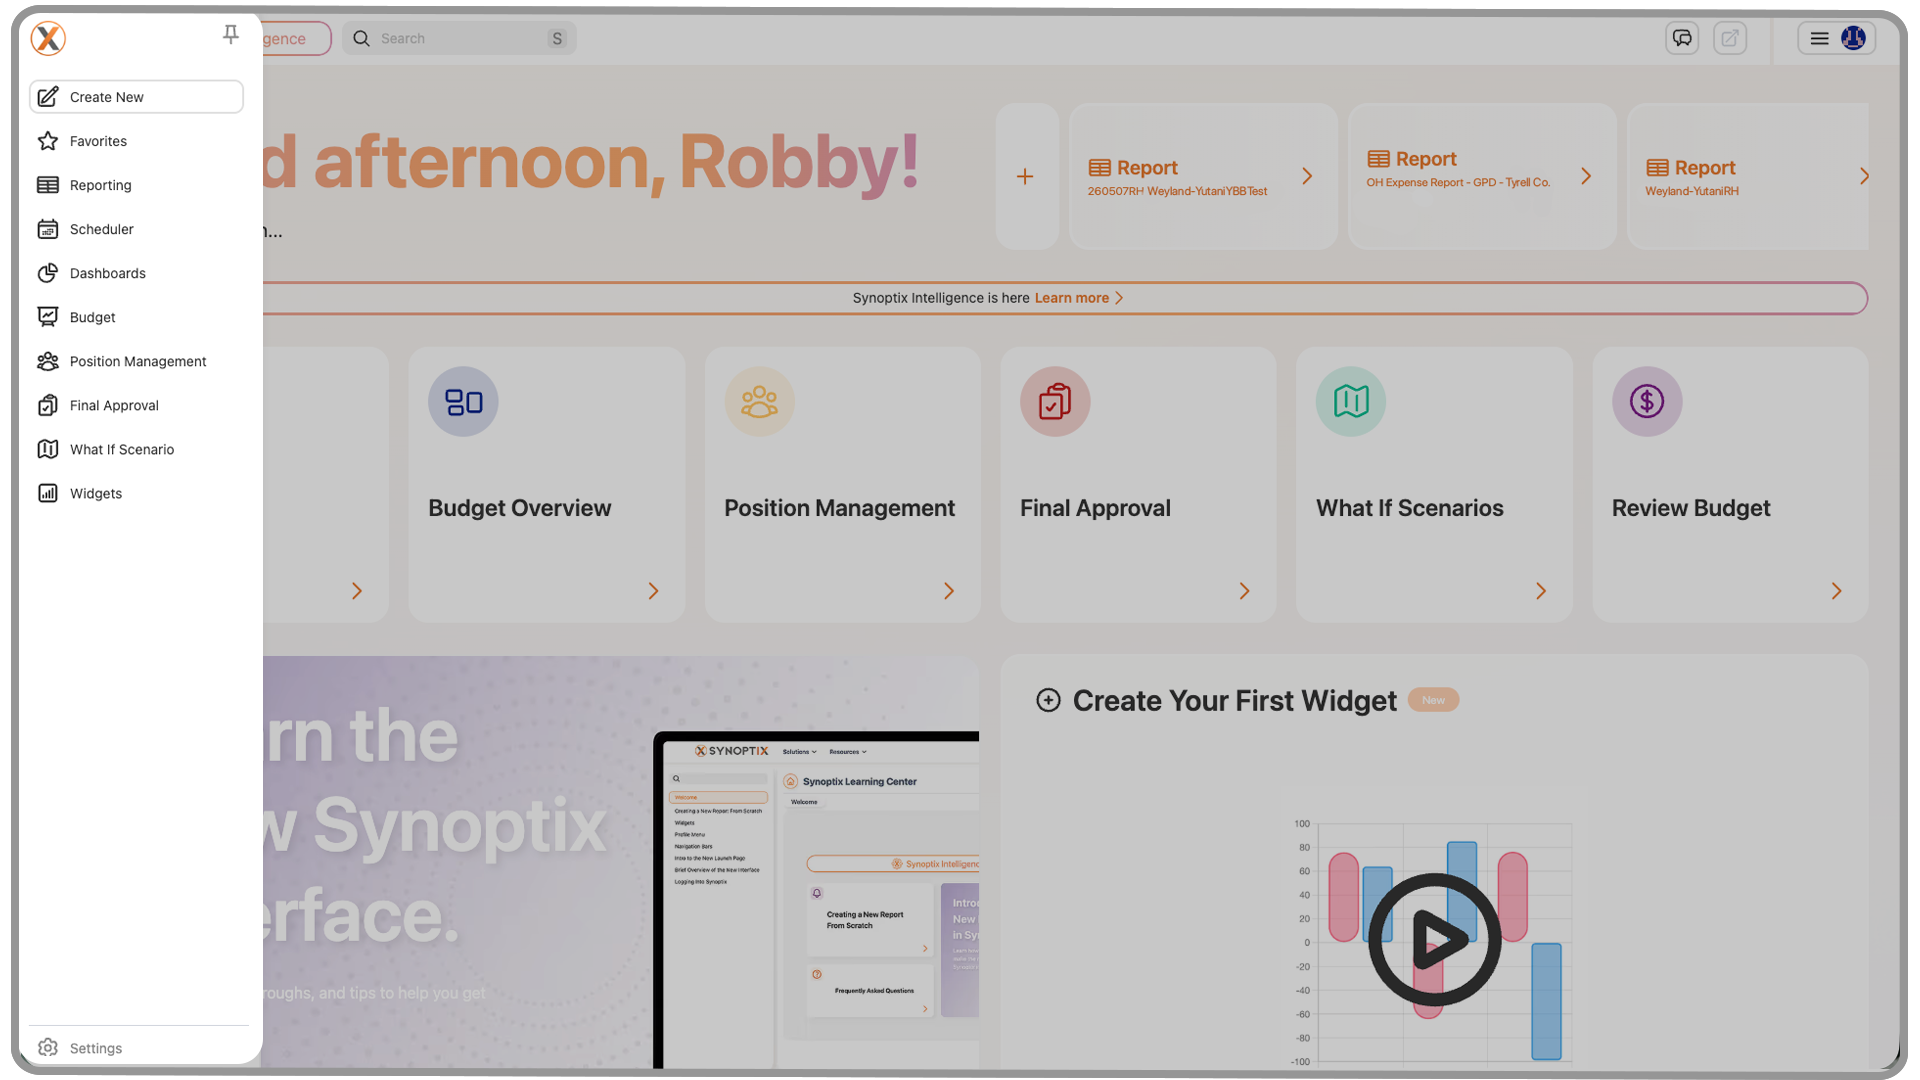
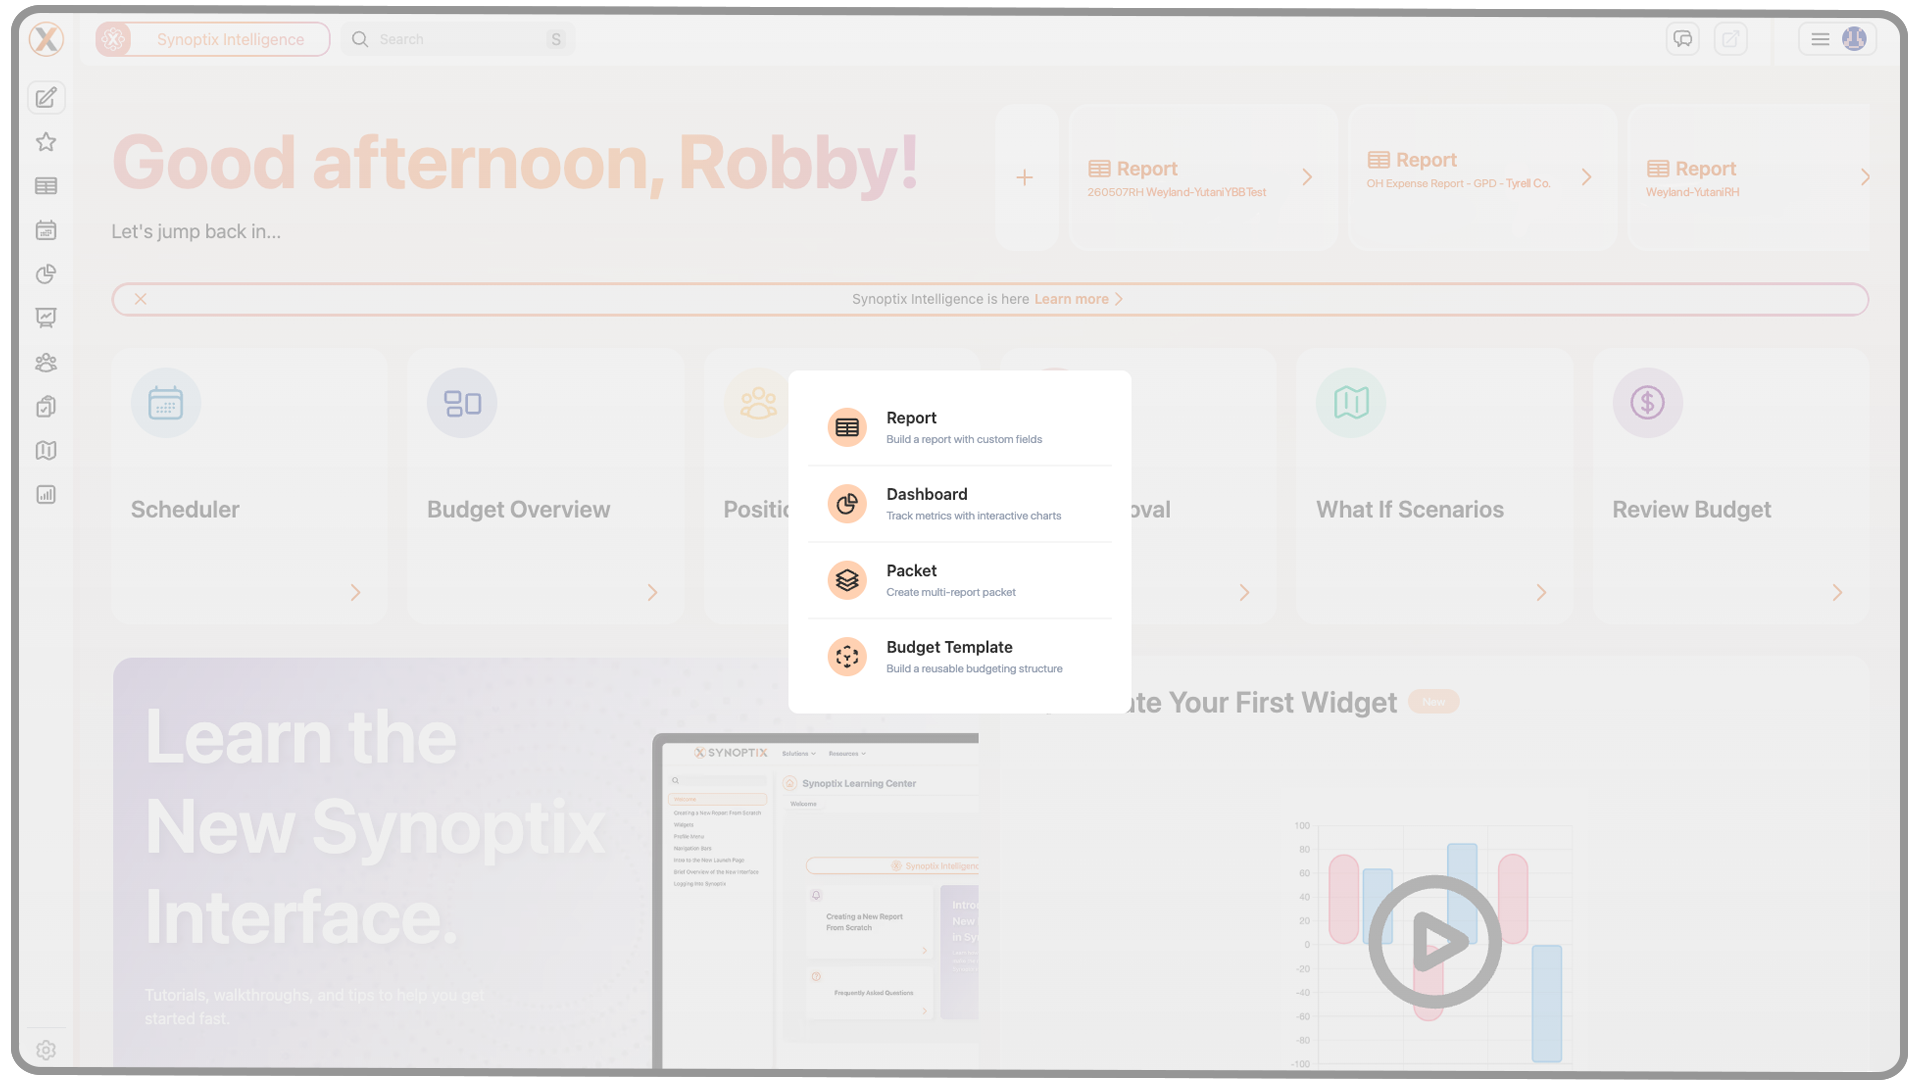
1.2 Create New
Below the Home button, you’ll find Create New.
Selecting this opens a small window where you can choose what type of content to create:
- Report
- Dashboard
- Budget
- Packet
This is your starting point for building new assets in Synoptix 11.
1.3 Favorites
Next is the Favorites section.
This menu gives you quick access to:
- Your ten most recent reports
- Any reports, dashboards, or packets you’ve favorited
In the top right corner of the Favorites panel, you’ll see a plus (+) button to create new items directly from Favorites.
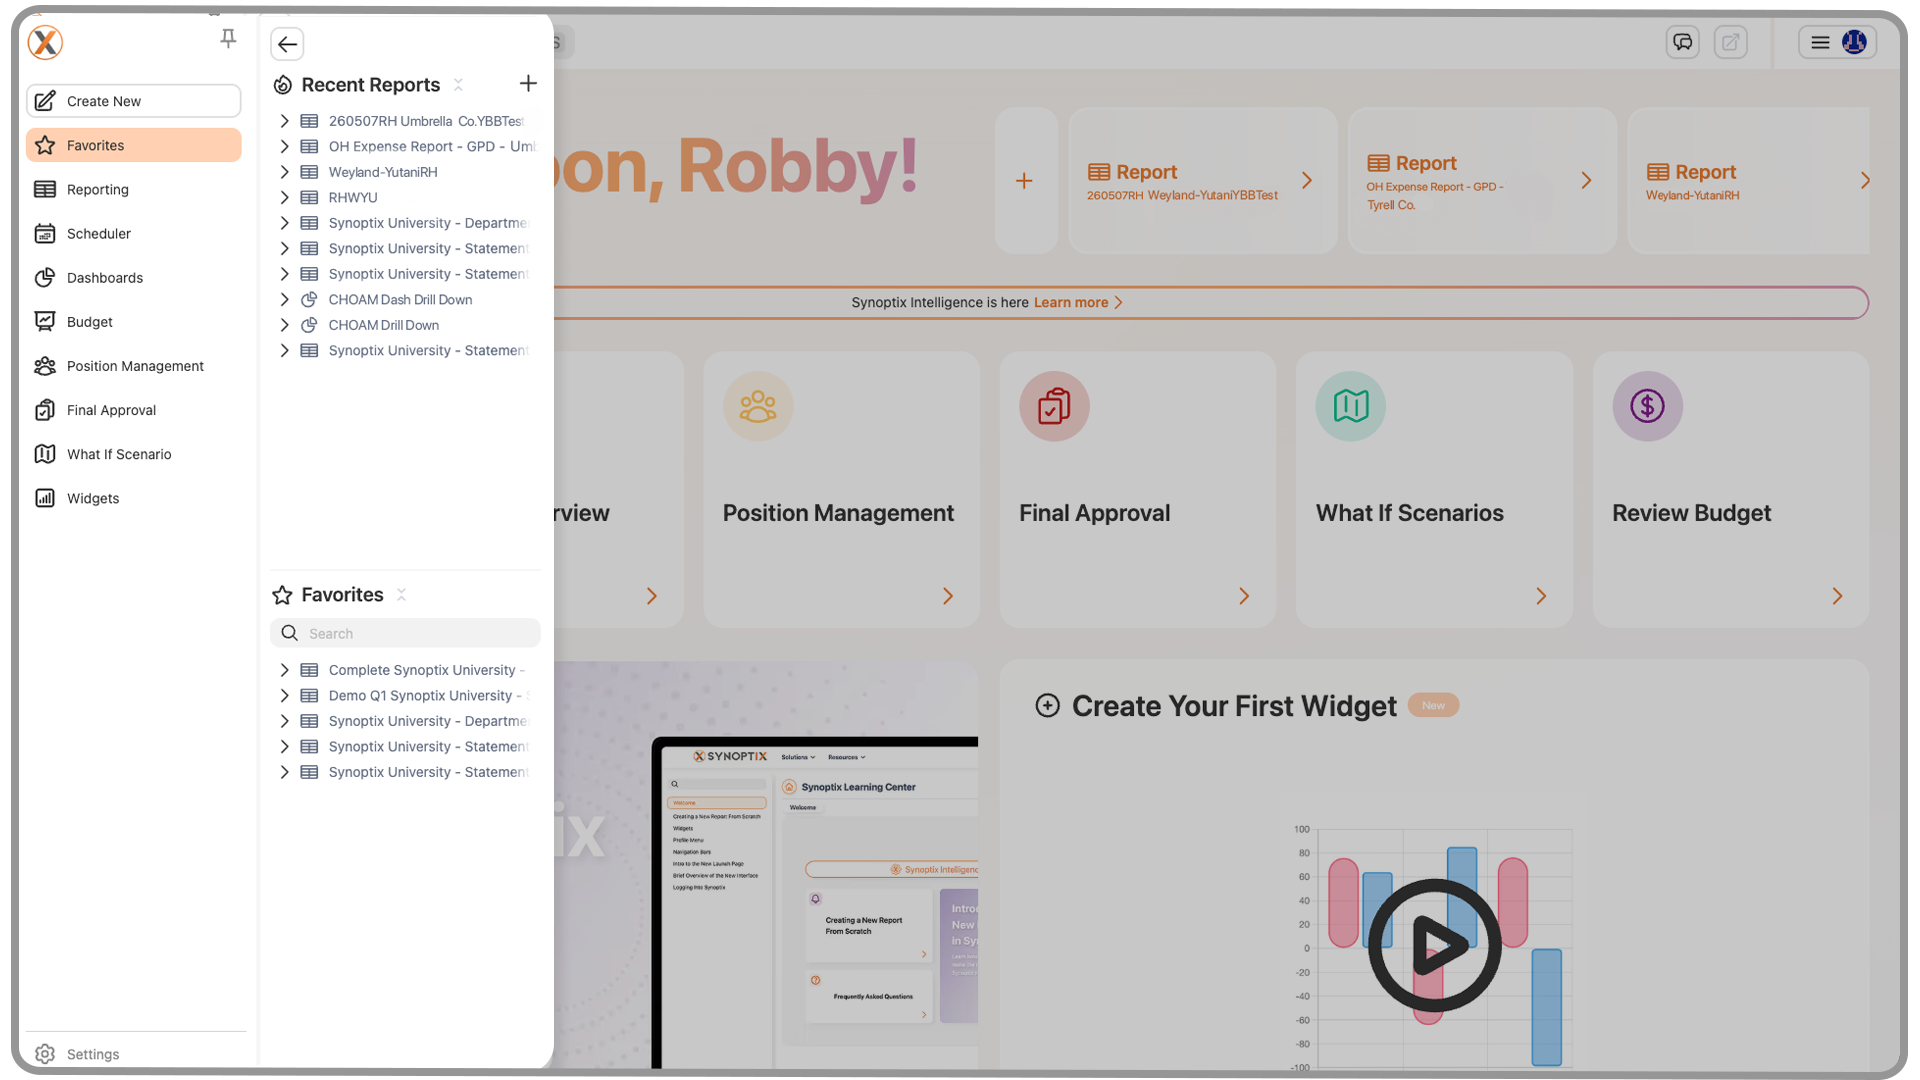
Each menu includes a Collapse All button next to its header—use this to reset your view to the top level, especially if your list has expanded or become cluttered.
1.4 Highlight Buttons
When you hover over an item in any menu, you’ll notice a set of highlight buttons appear on the right-hand side.
These may vary depending on the item type, but common ones include:
- Favorite (adds or removes items from your Favorites menu)
- Modify
- Export
- Delete
To run a report, simply click its name.
To favorite an item, click the star icon. Clicking it again will remove it from your Favorites.
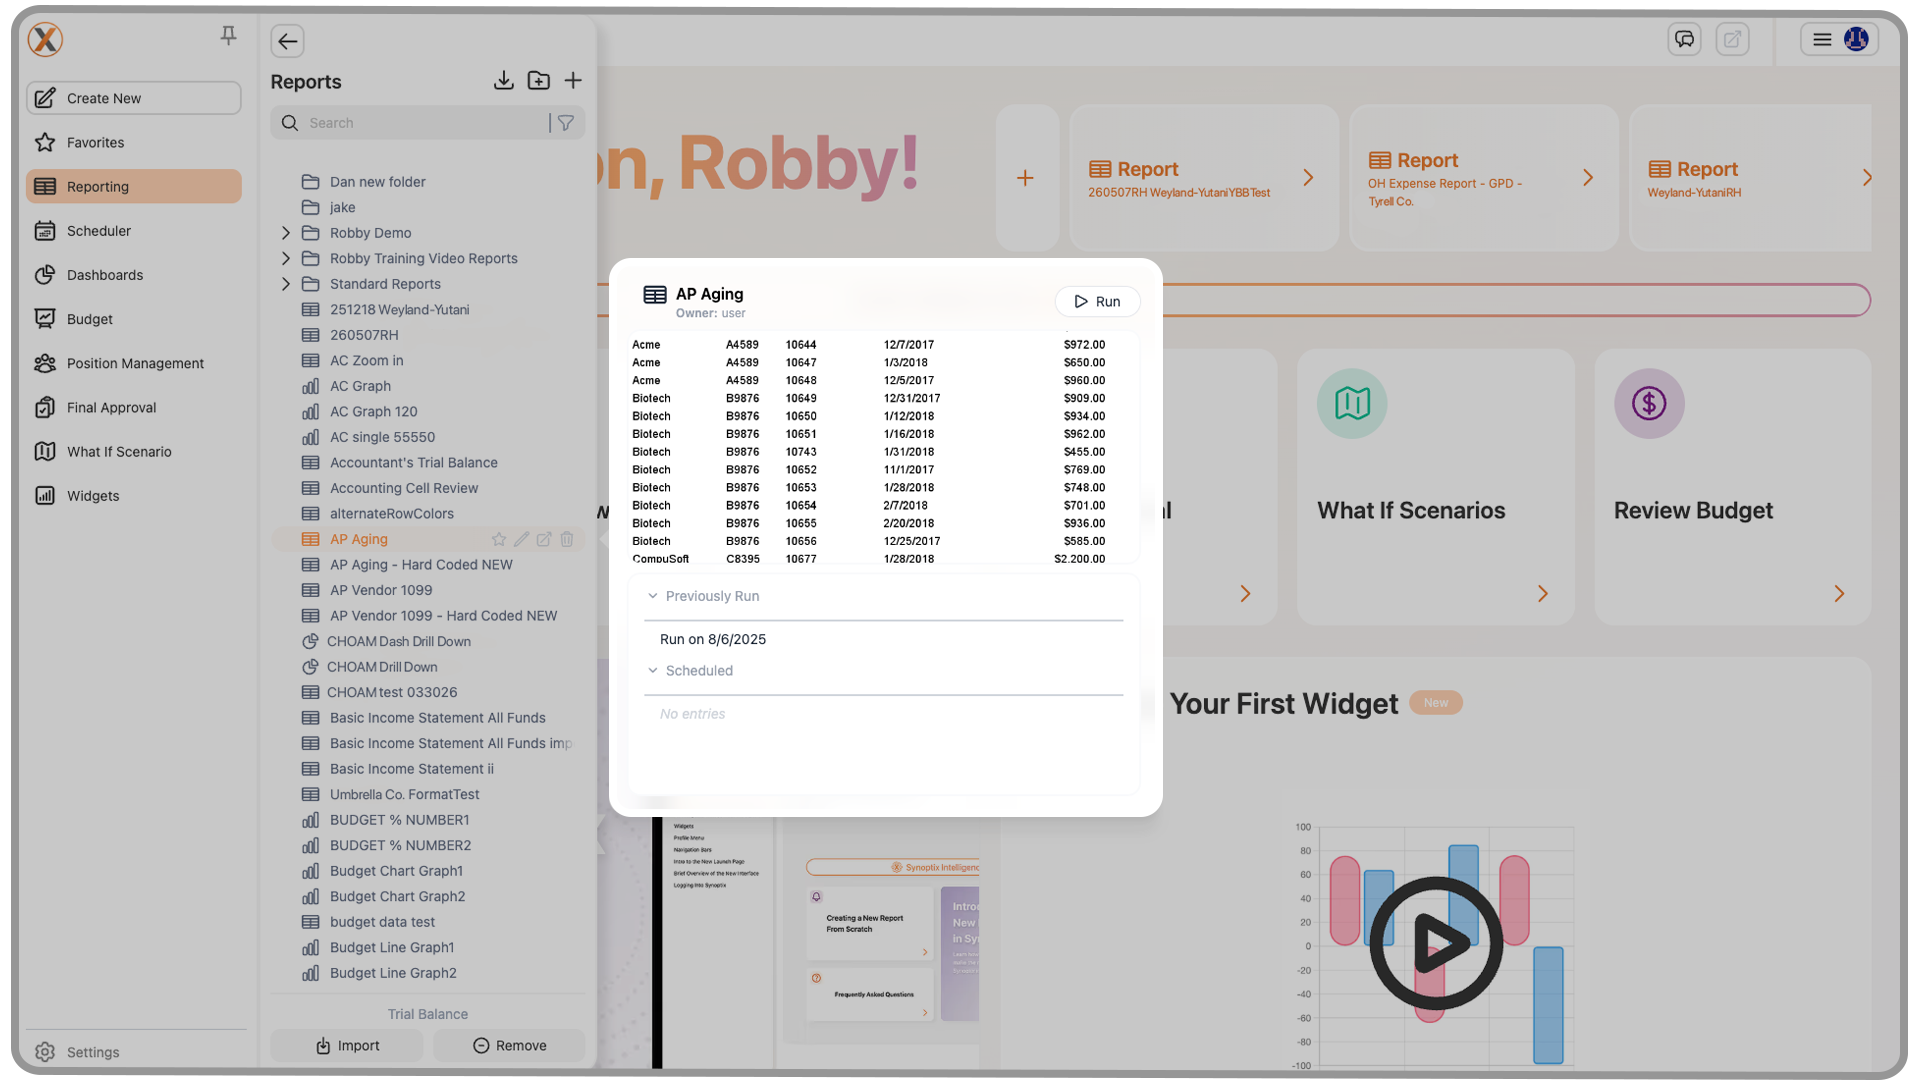
1.5 Report Preview Popup
When you hover over a report in the left-hand menu for a moment, Synoptix will open a small preview popover beside that report. This gives you a quick snapshot so you can confirm you’re looking at the right report before opening it.
The top of the popover displays:
- The report name and owner
- A Run button (that works similarly to clicking the report name)
In the center is a static image of the most recent version of the report. At the bottom of the popover is a scrollable list of Recently Run Versions, organized into three sections: Previously Run, Scheduled, and Historical. Clicking one of the listed report outputs opens that specific saved run directly.
Note: The preview image is intended to help you quickly recognize and confirm the report you’re hovering over. Because it is a static image, it does not support drill-down functionality or interactive exploration.
1.6 Pinning Tabs
In the top-right corner of the left-hand menu, you’ll see the Pin icon.
- When the pin is active, your current tab remains open and new content opens in a new tab.
- When the pin is inactive, opening a new item will replace what you’re currently viewing.
2. Reporting Menu
The Reporting section gives you complete access to all your reports.
At the top-right corner, you’ll find:
- A Create New button (to build a new report)
- A New Folder button (to organize your content)
You can drag and drop reports and folders to rearrange them as needed.
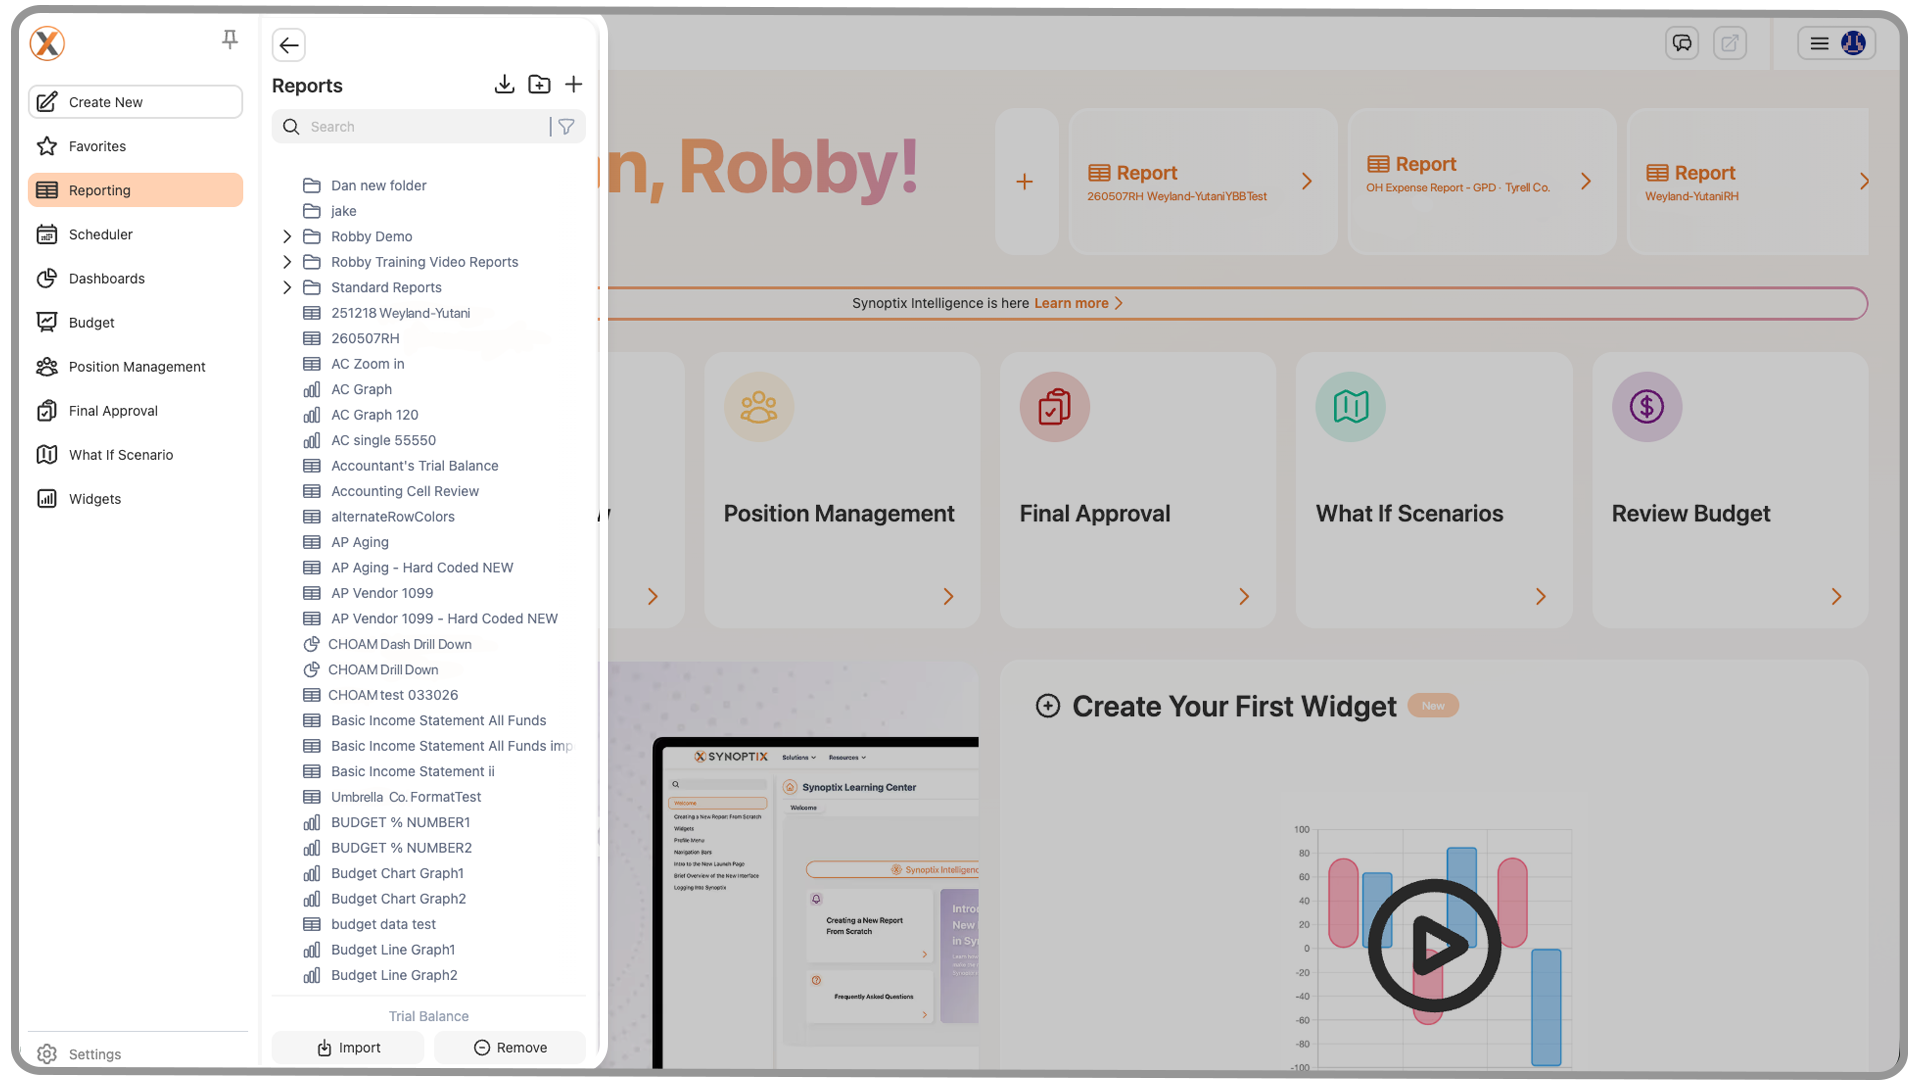
To narrow your list, click the Filter icon to view only packets or charts.
To clear your filter, click the “X” at the top-left of the menu.
3. Scheduler
The Scheduler menu lets you automate report generation and delivery.
You can configure reports to run on a set schedule and automatically send them to designated recipients—no manual effort required.
4. Dashboards
From the Dashboards menu, you can:
- Access all saved dashboards
- Use the plus (+) button in the top-right corner to open the Dashboard Designer and create new dashboards
This menu functions similarly to the others, ensuring a consistent experience throughout the platform.
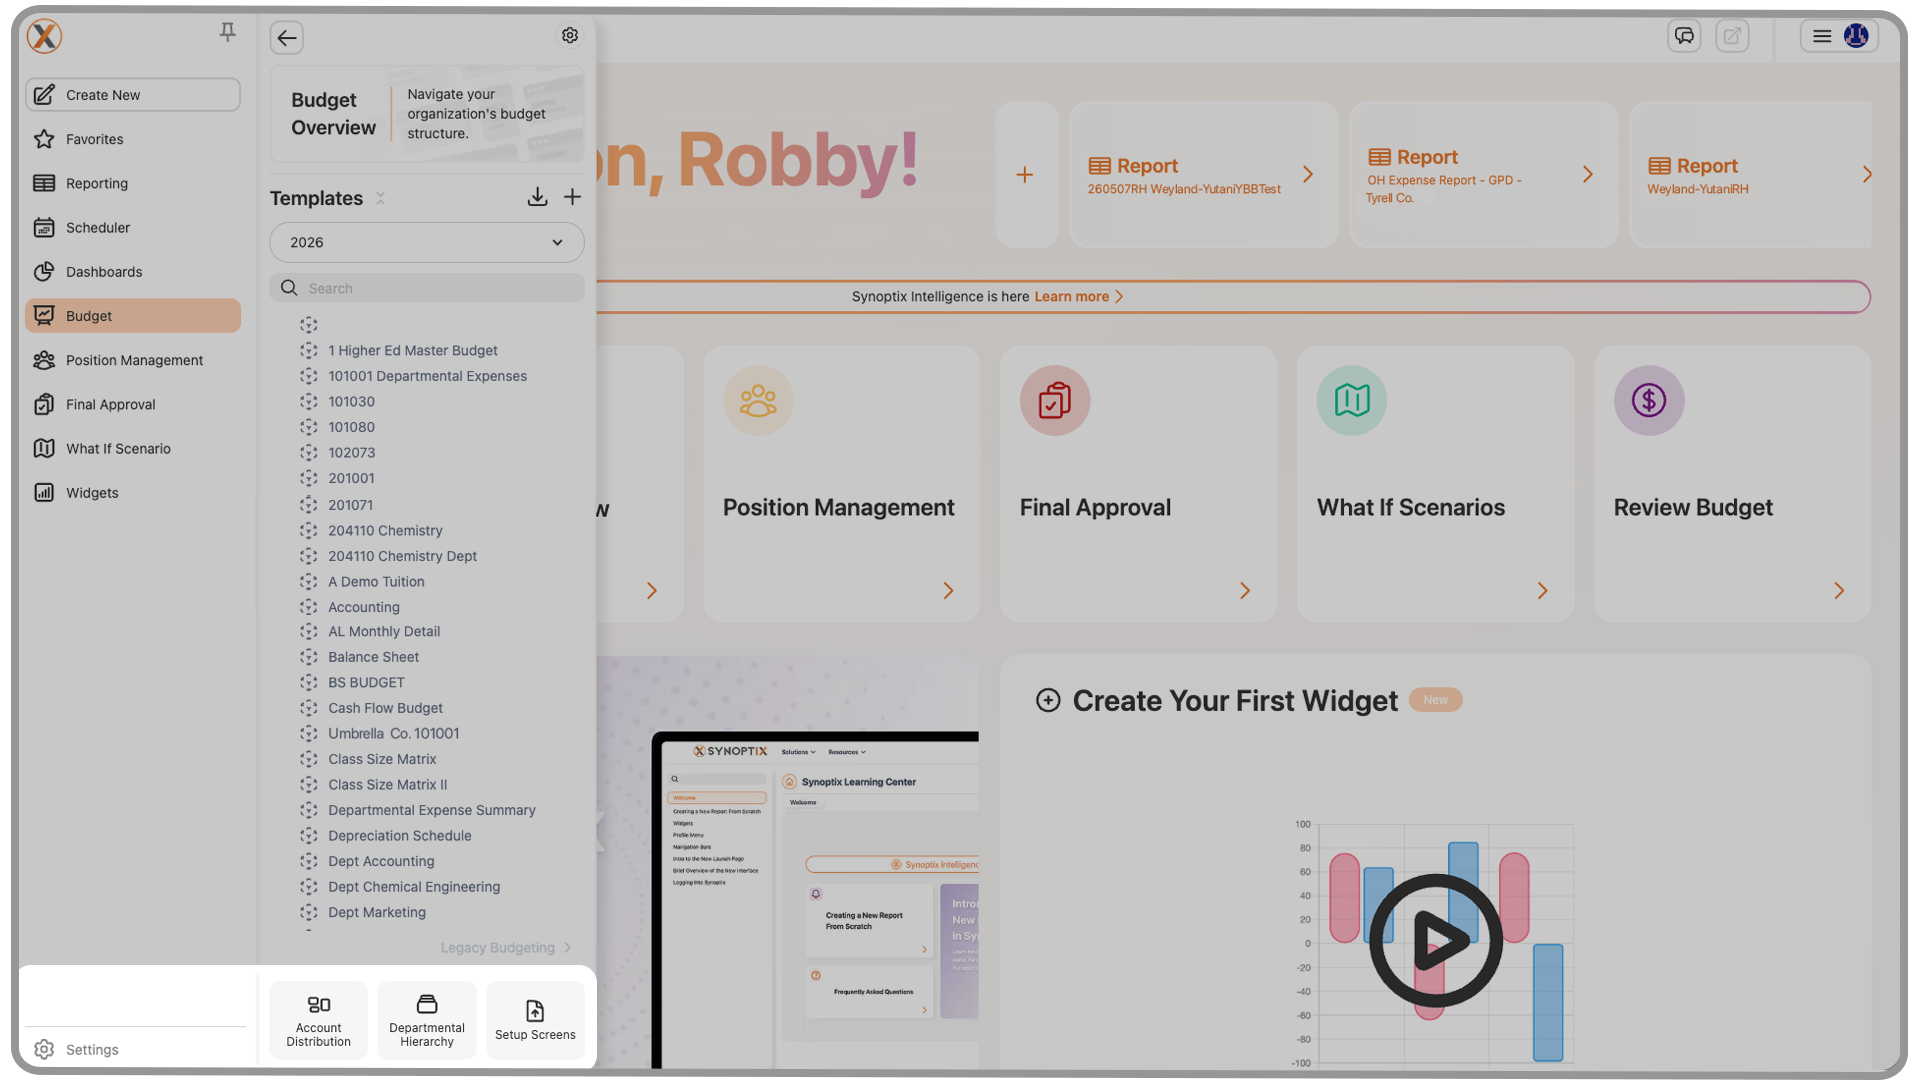
5. Budget Menu and Budget Features
The Budget menu provides access to your organization’s budgeting tools.
5.1 Budget Overview
At the top, you’ll find the Budget Overview—a snapshot of your organization’s full budget structure and progress.
Below that are two buttons:
- Import Budget
- Create New
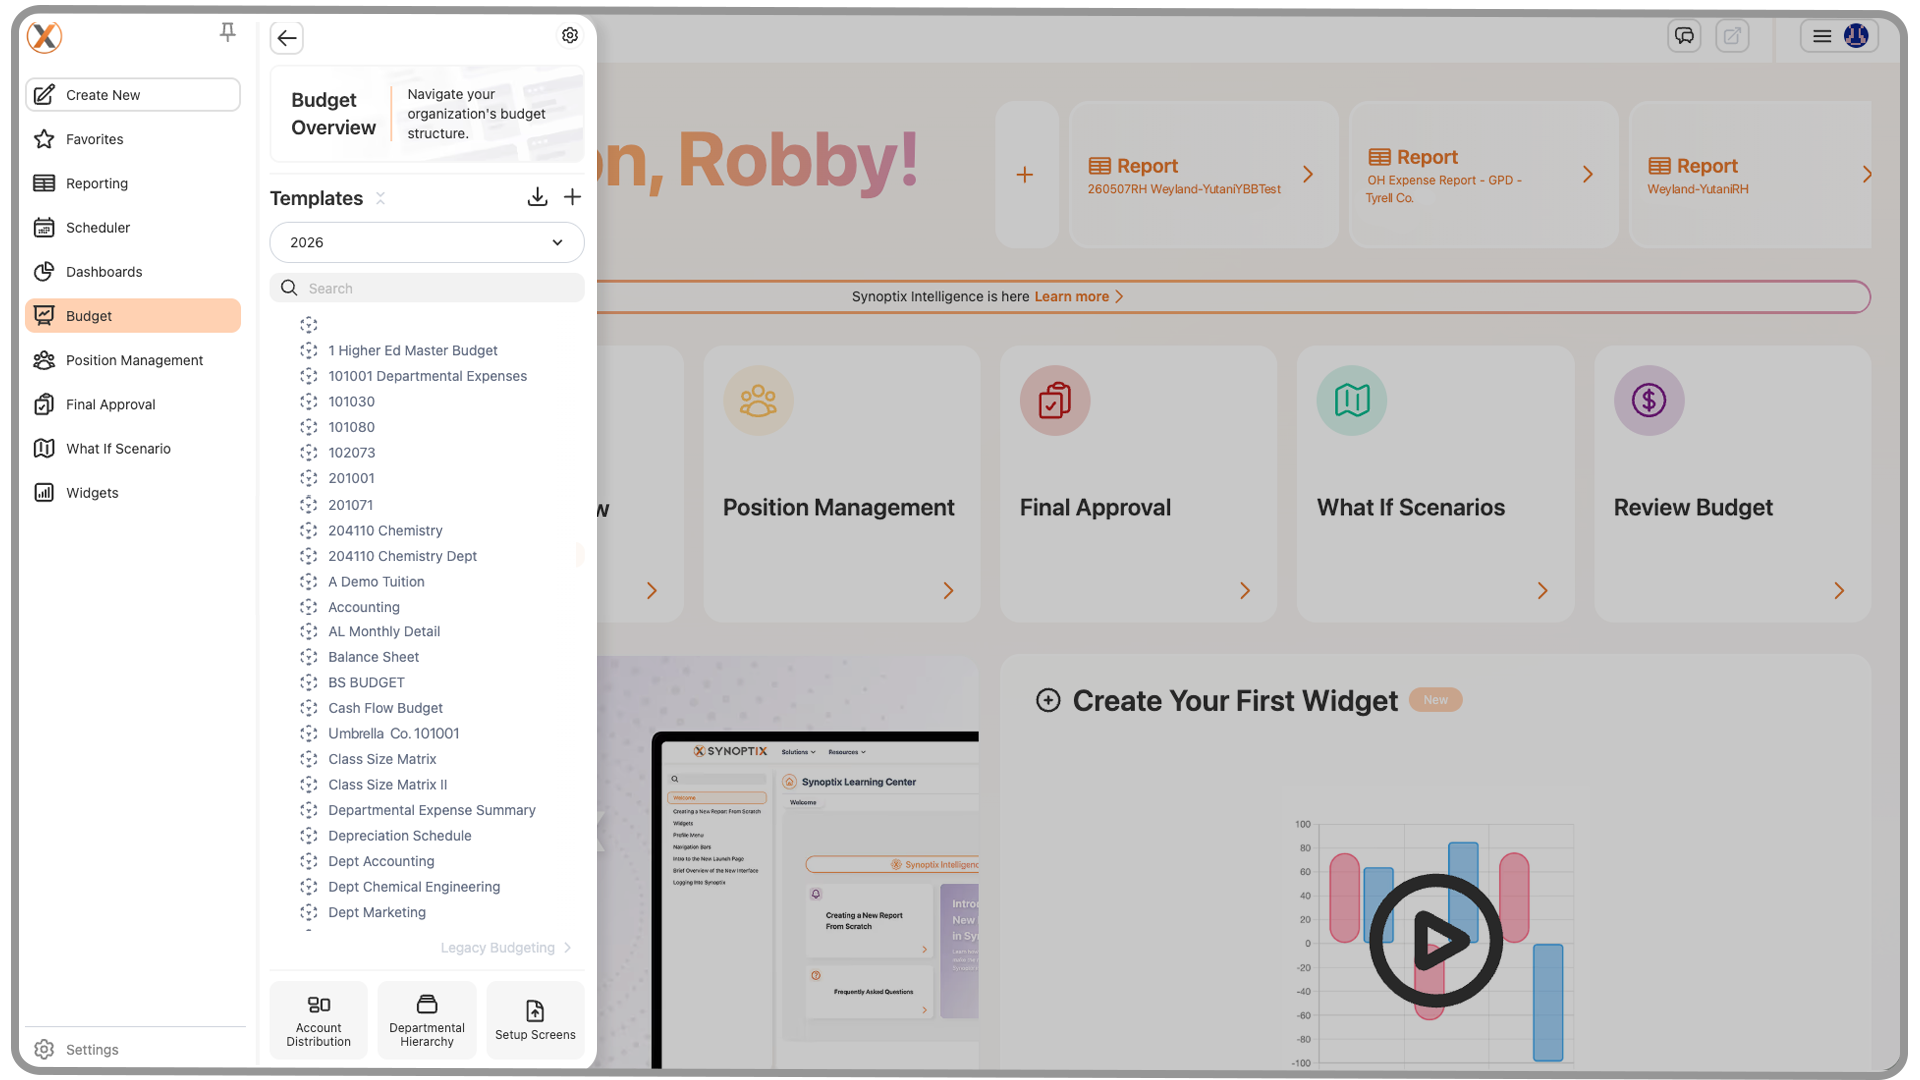
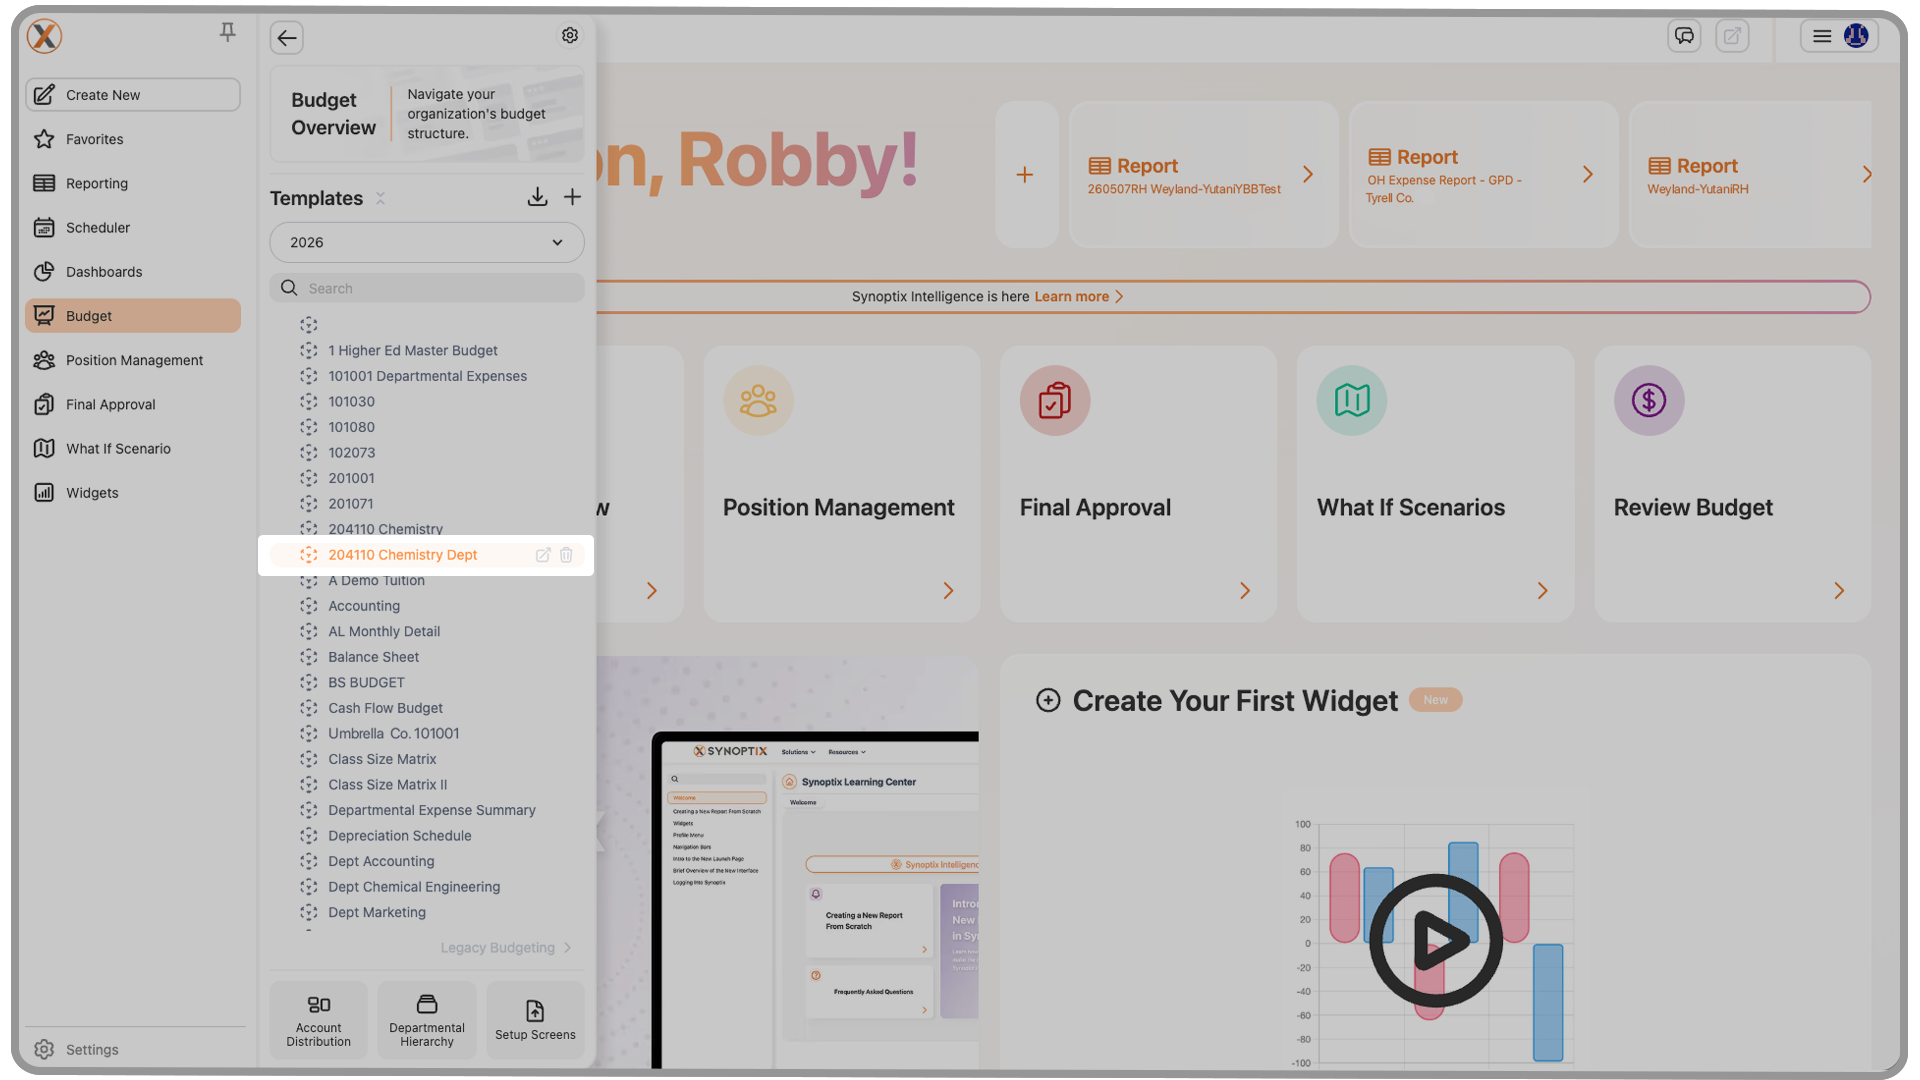
5.2 Year Selector
The Year Selector allows you to view budgets by year.
Expanding a selected year displays its budget templates. Expanding a template further reveals run versions, known as sheets.
The orange number beside each sheet indicates how many versions exist.
5.3 Budget Settings
In the top-right corner of this section, you’ll find Budget Settings for managing configuration options.
5.4 Key Options
At the bottom of the Budget menu are three important tools:
- Account Distribution
- Departmental Hierarchy
- Setup Screens
5.5 Additional Budgeting Features
Following the Budget menu, you’ll find three advanced features:
- Position Management
- Final Approval
- What-If Scenarios
These powerful tools let you manage, finalize, and model your budgets with flexibility. Each will be explored in separate training modules.

6. Widgets
The Widgets menu leads to the Widget Designer, where you can create and manage widgets that display data on your Launch Page.
You’ll find a full library of widget templates that can be customized and added as needed.
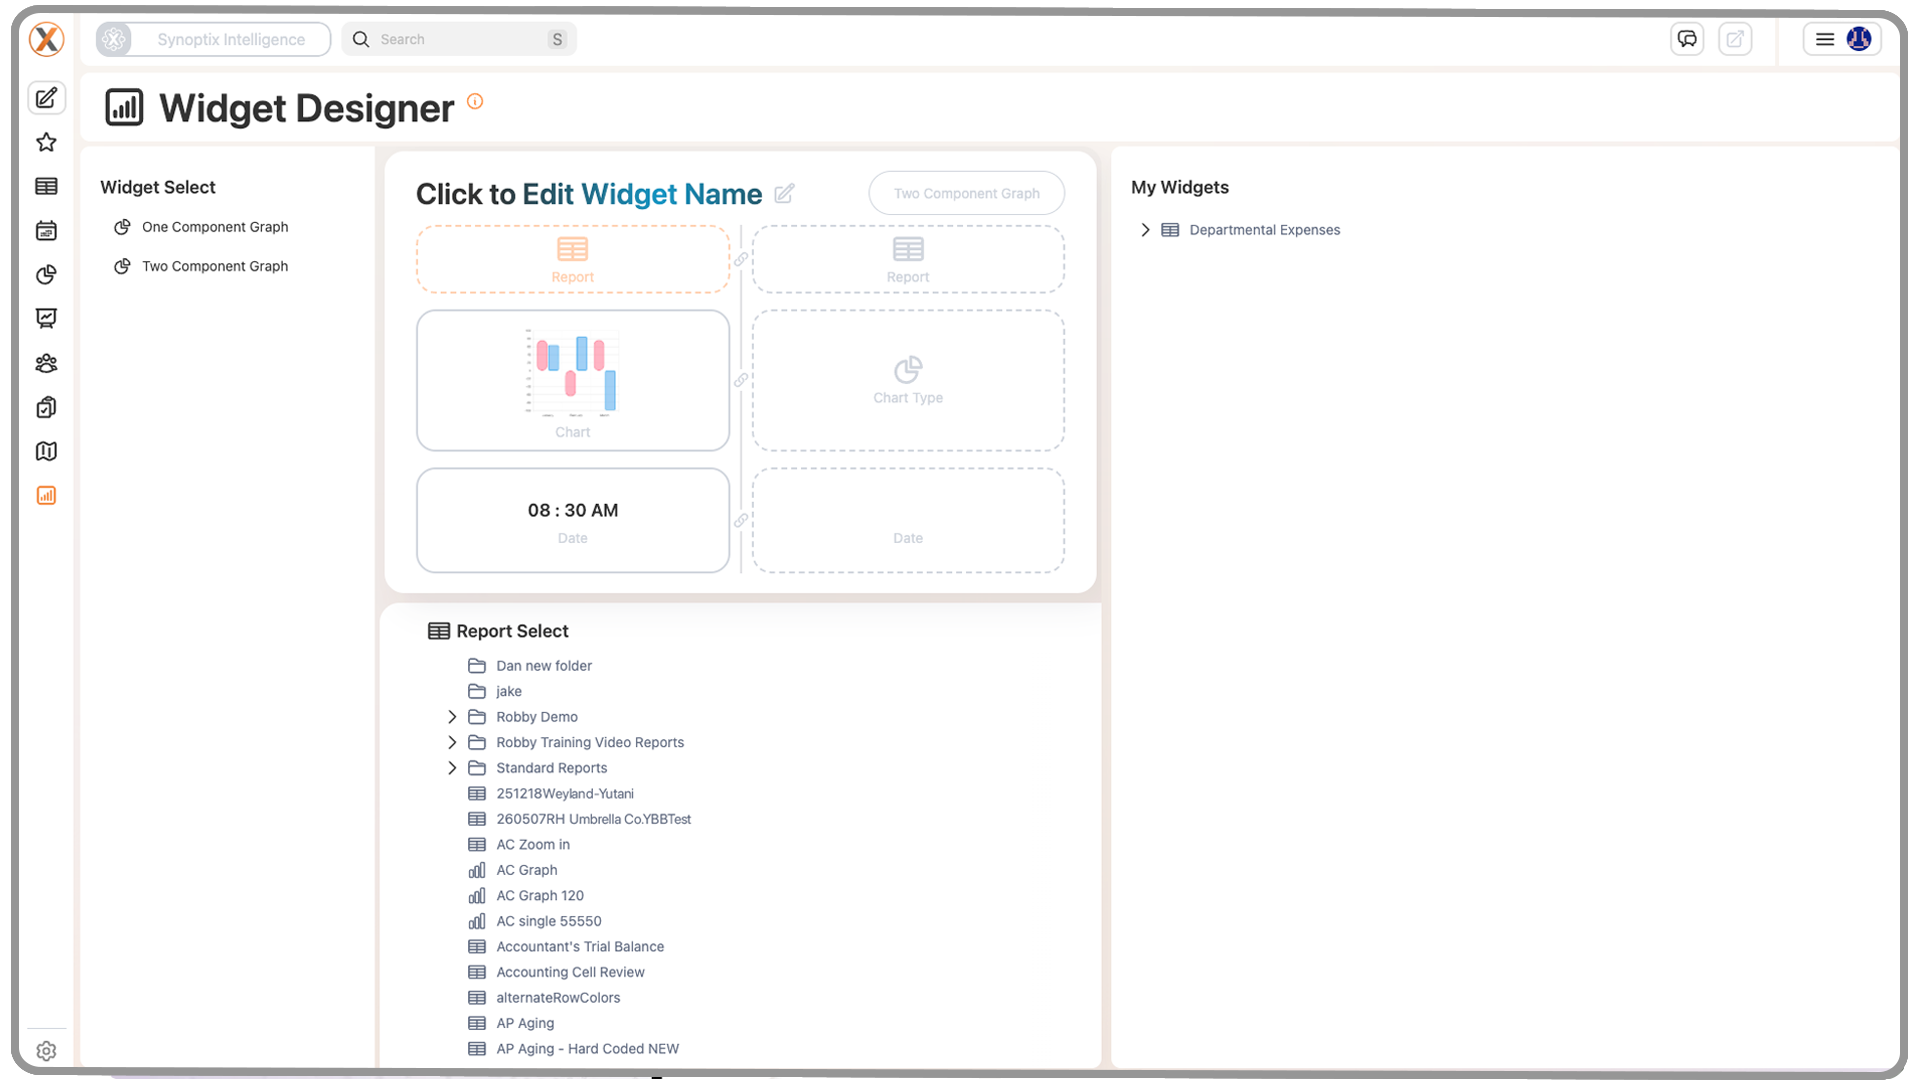
Widgets are a great way to surface KPIs, charts, and other visual insights right on your Launch Page, helping you monitor the metrics that matter most.
7. Top Navigation Bar
Across the top of Synoptix 11, you’ll find the Top Navigation Bar, which houses global tools and contextual options.
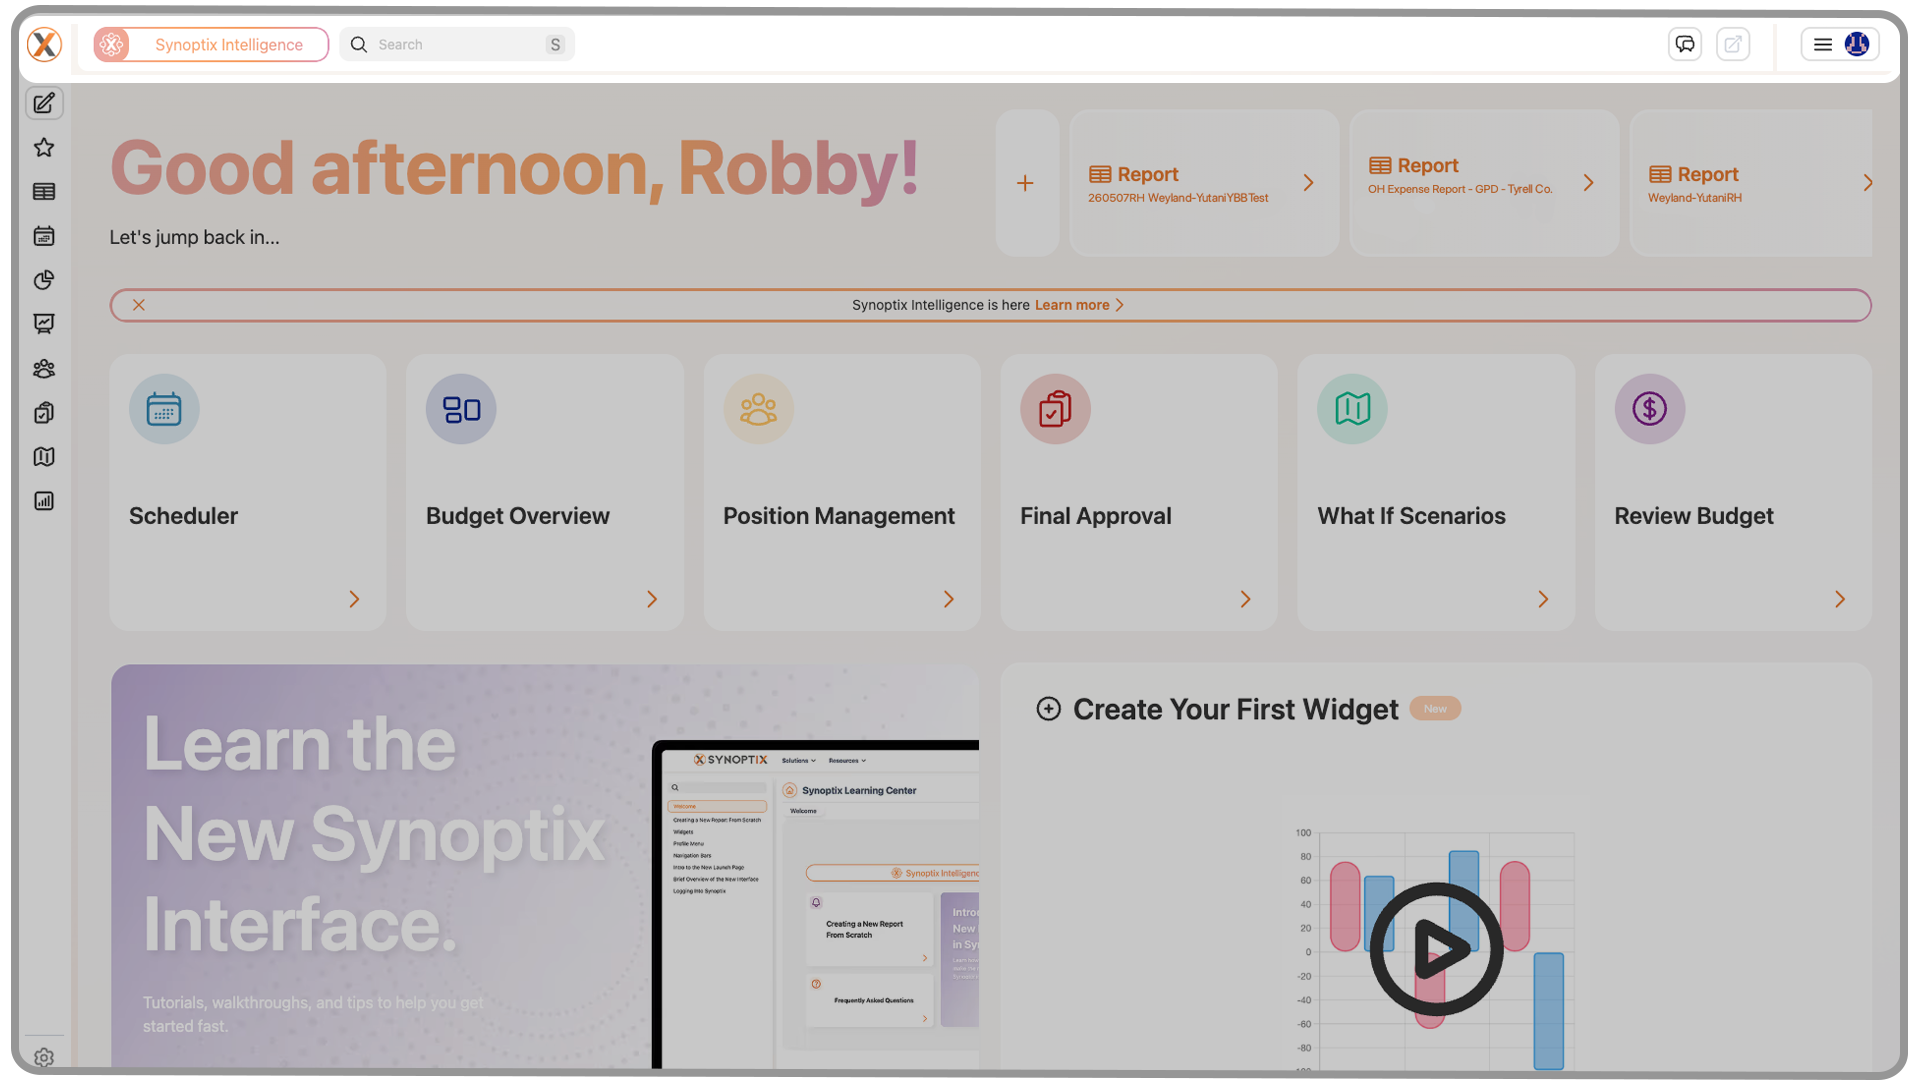
7.1 Synoptix Intelligence
This button provides AI-driven insights on select reports, helping you interpret and understand your data quickly.
7.2 Search Bar
Use the Search Bar to locate reports, dashboards, budgets, or other items instantly.
Type a keyword, and Synoptix will display matching results.
7.3 Conversations
The Conversations button displays discussions or comments linked to the report you’re viewing.
This feature keeps collaboration tied directly to your data, avoiding the need for separate email or chat threads.
7.4 Export
The Export button lets you download or share your current report in various formats for distribution or offline analysis.
8. Profile Menu
Located on the far right of the top navigation bar, the Profile Menu allows you to manage personal preferences, account settings, and support options.
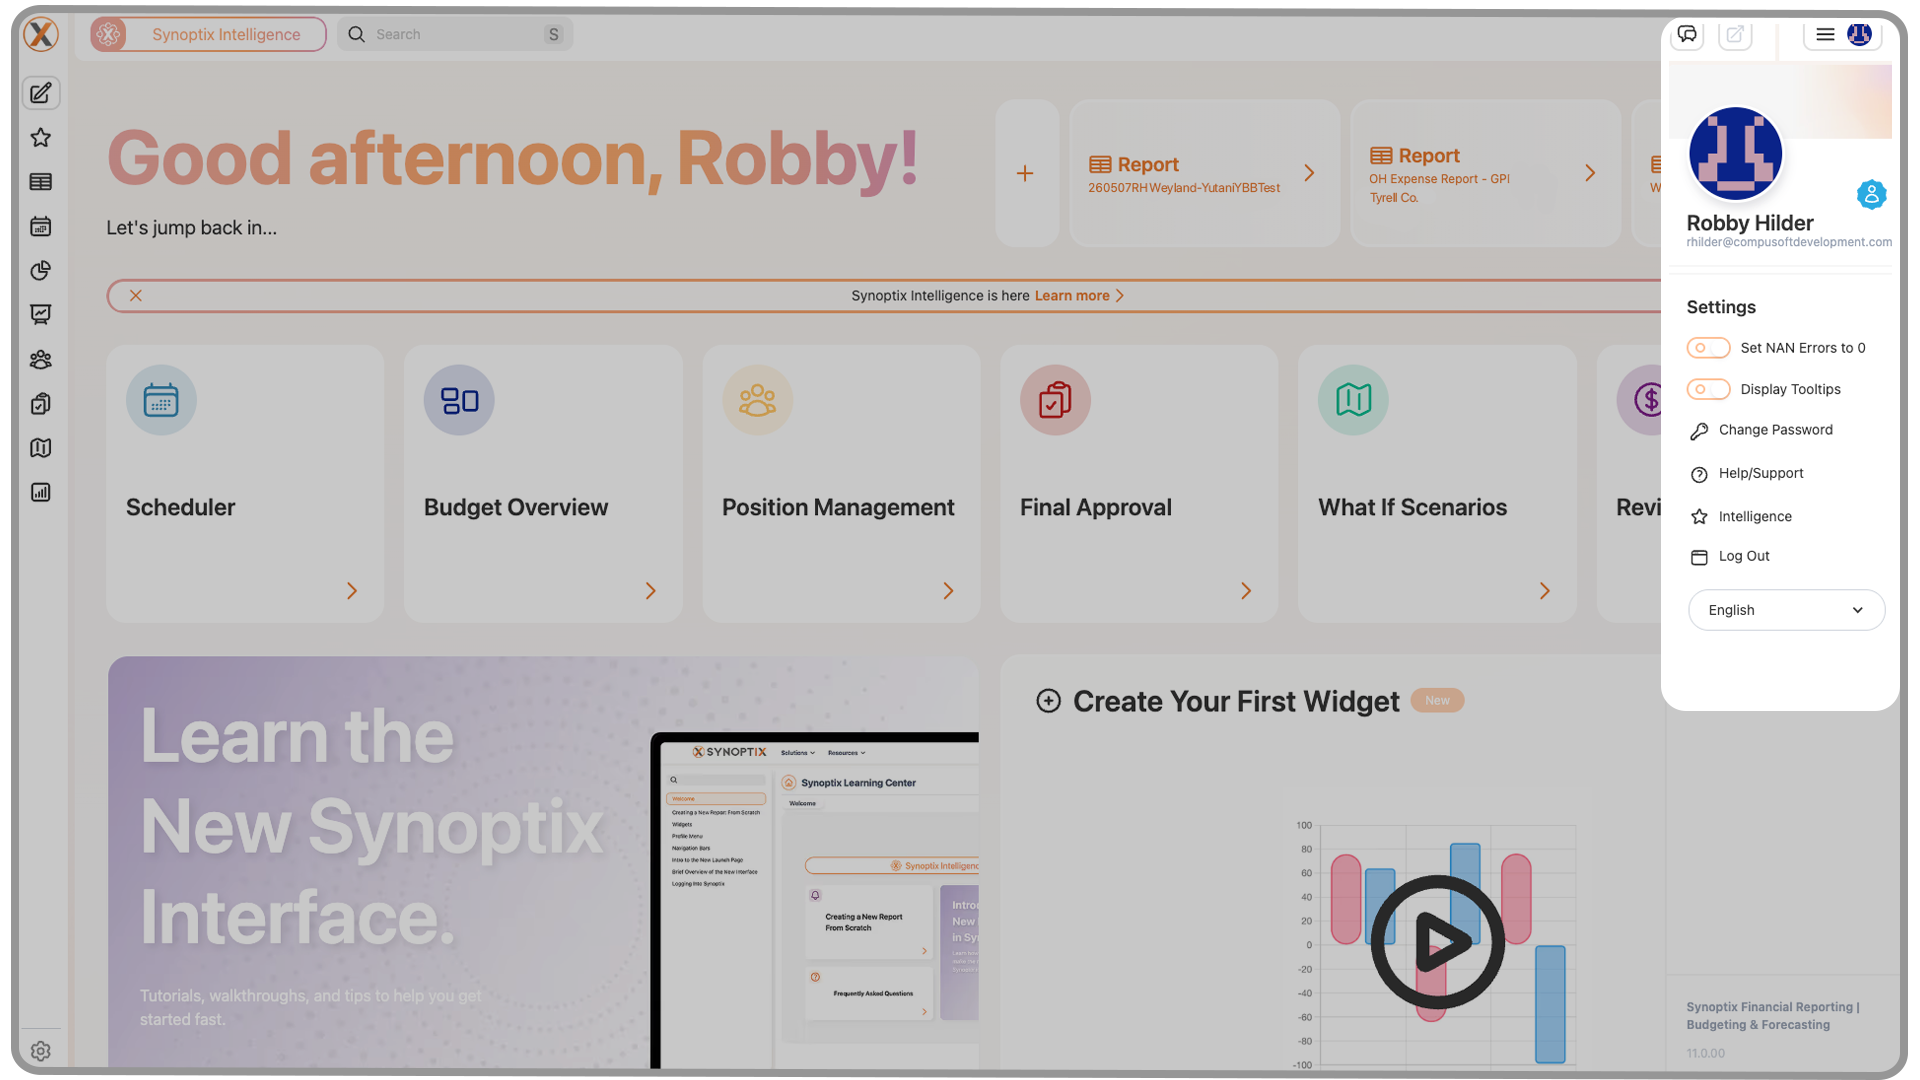
8.1 Options and Toggles
Adjust how Synoptix behaves through environment-specific options, such as:
- Setting Not a Number (NaN) values to zero
- Displaying or hiding tooltips
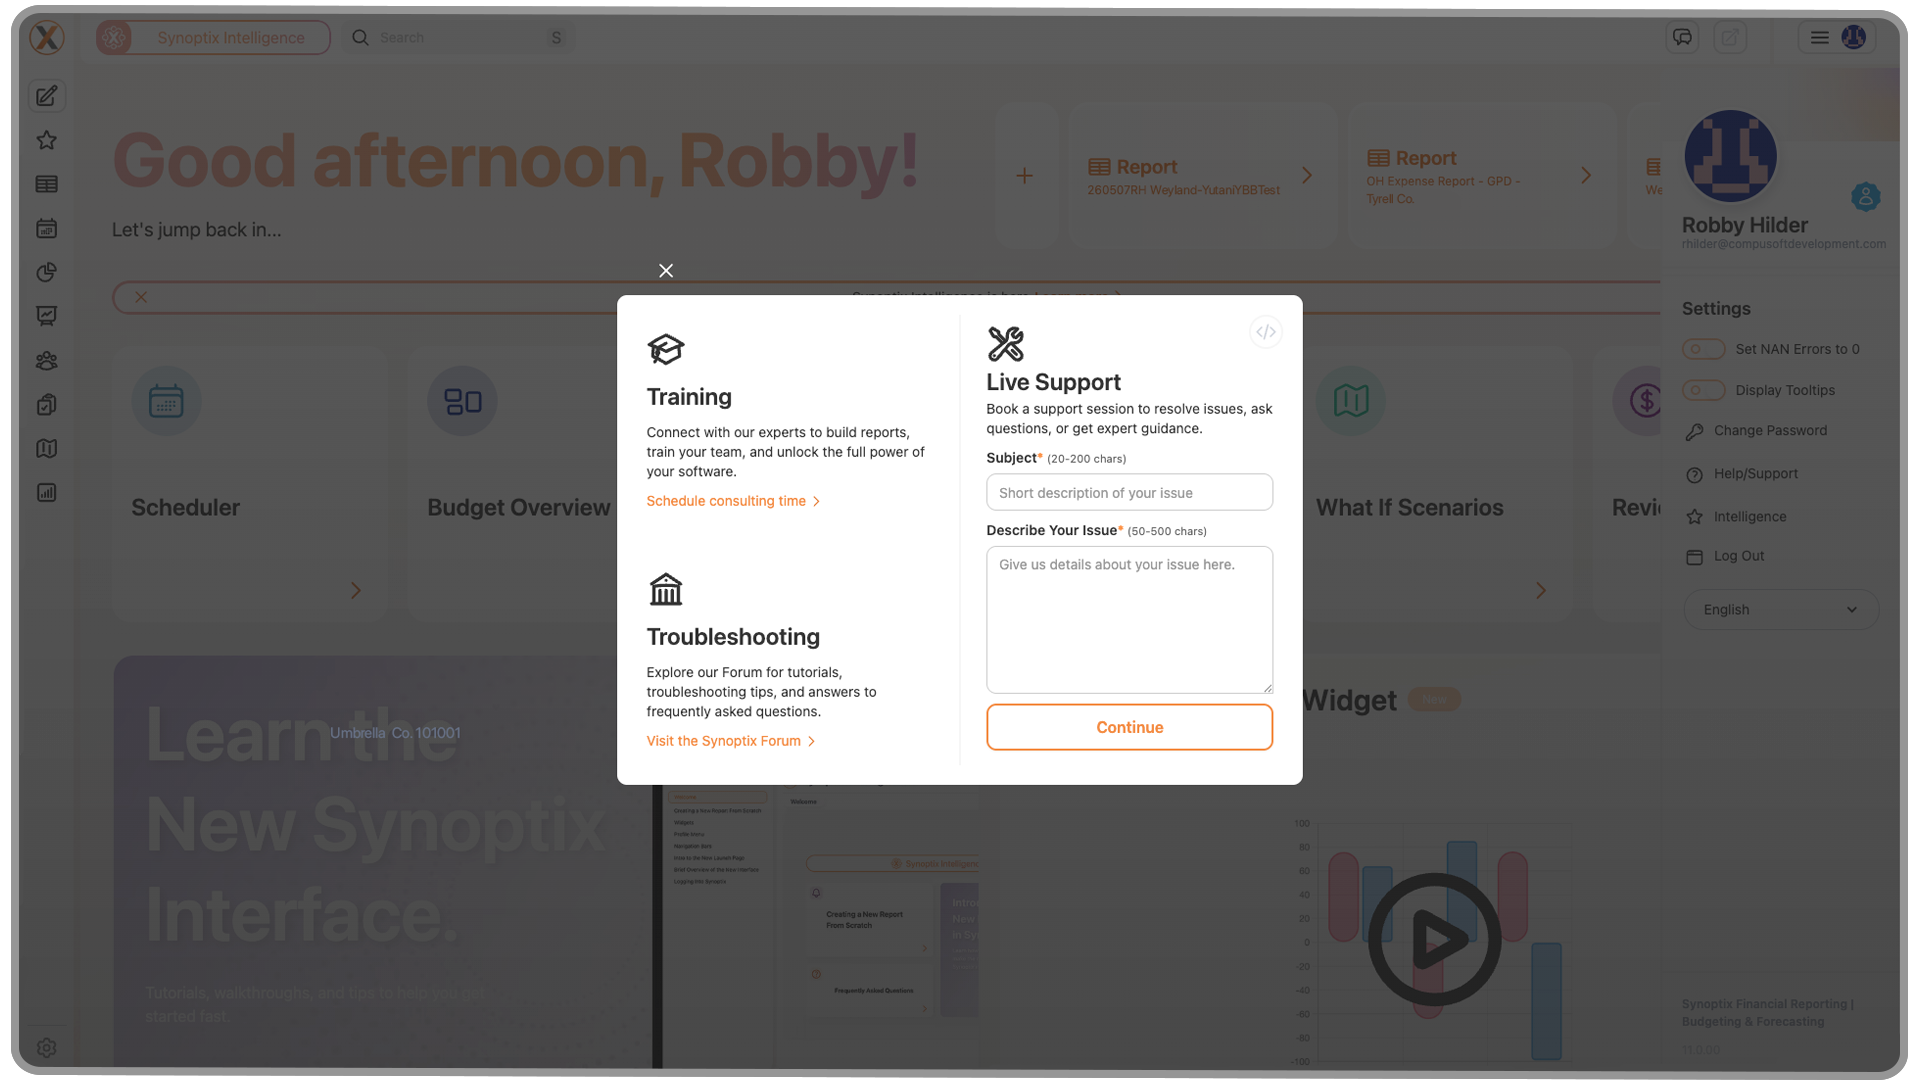
8.2 Account and Support
Here you can:
- Change your password
- Access Get Support to connect with Synoptix help resources
- Log Out or view your current Version information
9. Summary
That’s the new navigation system in Synoptix 11.
Every menu follows a consistent, intuitive structure—so once you’ve learned one, the rest will feel familiar.
This redesign is focused on helping you:
- Find what you need faster
- Reduce clutter
- Keep your work streamlined and efficient
If you’d like additional training or want to activate features your organization hasn’t implemented yet, contact our team for help.
For more tutorials, visit the Synoptix Learning Center for step-by-step guides and videos.
Synoptix Logo
Acts as a Home button, returning you to your Launch Page.
Pin Tab
Lets users choose whether new content opens in a new tab or replaces your current tab.
Create New
Opens a small window to create a new workspace or report.
Favorites
Expands to show your ten most recent reports and any items marked as favorites.
Reporting
Lets you search, filter, and access all reports, graphs, and packets.
Scheduler
Automates report generation and distribution across your organization.
Dashboard Designer
Create and customize your own dynamic dashboards.
Budgeting & Forecasting
• Budget Overview
• Budget Templates
• Position Management
• Final Approval
• What-If Scenarios
Access the full budgeting suite including:
Displays your full budget structure and progress at a glance.
Shows all templates by budget year and version.
Manage positions within your budgeting model.
Review and finalize budgets before submission.
Run hypothetical forecasts for planning flexibility.